Widgets
Each widget contains a specific type of data, summarized below.
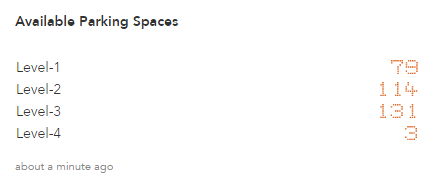
Available Parking Spaces: Shows the available number of parking spaces in each zone of each garage at the site. Holding the cursor over the data shows the number of parking spaces available over the total number of parking spaces for that zone.
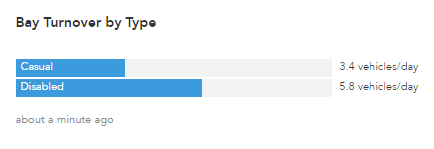
Bay Turnover by Type: Shows a specific type of bay and its average turnover per day.
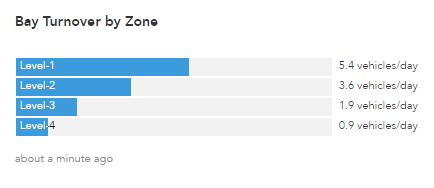
Bay Turnover by Zone: Shows the turnover for each zone of the site.
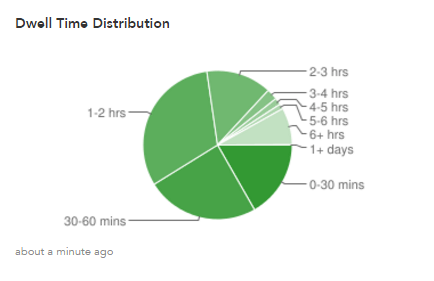
Dwell Time Distribution: Shows a pie chart giving the proportion of dwell time in several categories site-wide.
Occupancy: Shows the percentage of bays that are in use across the entire site.
Occupancy by Region: Shows the occupancy percentage of each region.
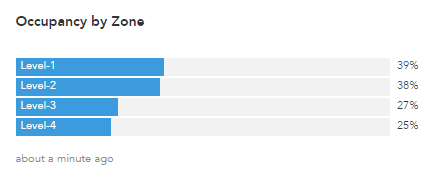
Occupancy by Zone: Shows the percentage of occupancy by zone for the entire site.
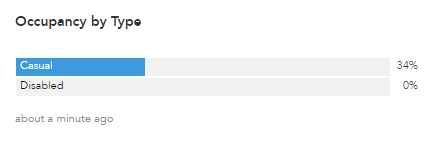
Occupancy by Type: Shows the percentage of occupancy by bay type, site-wide.
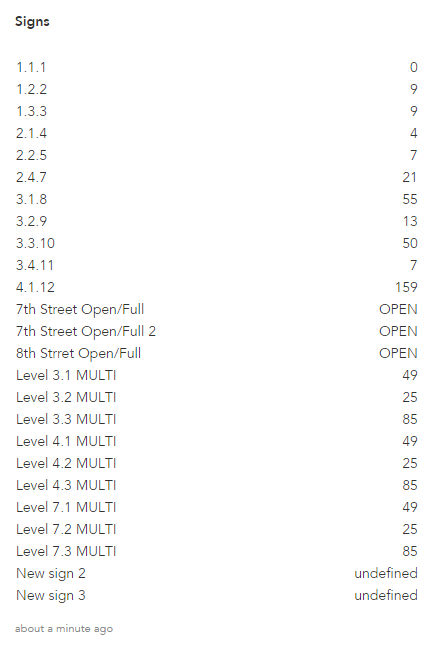
Signs: Shows what each sign displays in real time.
See Definitions above for more information
