Chart Builder
The Chart Builder is a custom chart generator. Users can hone the type of graph and data sets presented to achieve the exact comparison needed.
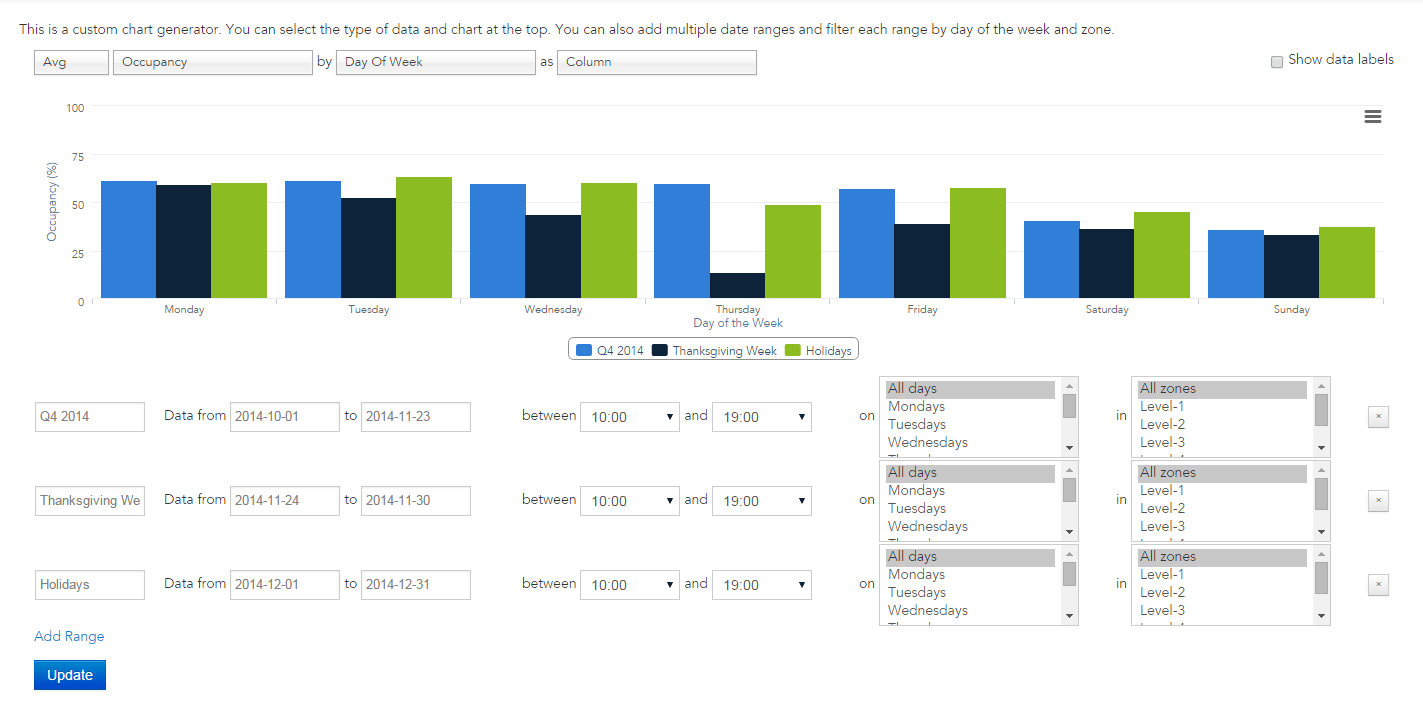
Chart Basic Controls
Along the top of the page are controls that govern the chart’s organization and visual appearance.
- Average/Min/Max: Sets average, minimum, or maximum values used for calculation
- Data type: Occupancy, turnover, dwell time, or number of visits
- Groupings: How to organize the horizontal axis: by day of week, hour, zone, or bay type
- Time Series: Another horizontal axis control, setting for a yearly, quarterly, monthly, weekly, or daily time series. Note that the date range for each data series should encompass two or more units of the time series for the comparison to be useful, e.g. at least two weeks for weekly.
- Chart Type: Column, line, area, bar, or scatter chart
- Show data labels: Show or hide data labels per point on the chart. Data values can also be seen by hovering over the desired data point.
Data Range Selection
Different data can be compared by creating/editing data ranges. Each range can be given a name, and has settings for date and time range, day of week, and zone. To add a data range, click “Add Range” at lower left. To remove a data range, click the X button to the right of the range settings.
Data ranges can also be hidden by clicking on the legend below the chart. The entire chart can be exported by clicking on the three-bar icon at the top right of the chart area.