Customer Movement
The rich parking data collected by Park Assist, including license plates, allows for a true look at parkers’ frequency of visit. The Customer Movement table depicts the distribution of customers based on their visiting habits. It also displays how the customer transitioned between different visit frequency categories. Resellers and Admins are able to view reports for all sites they cover.
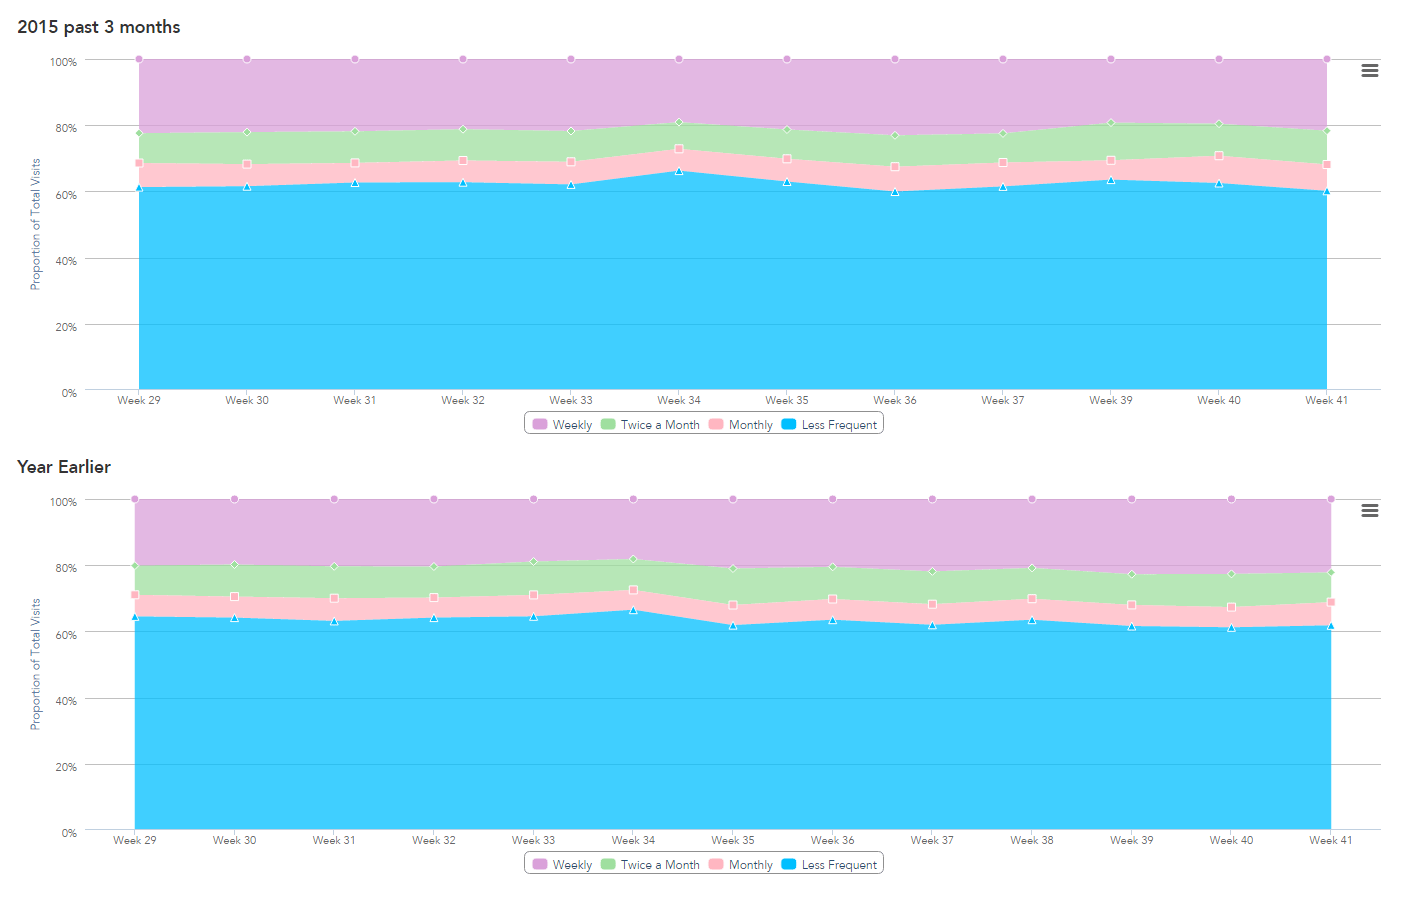
Each sample is based on a calendar quarter, or 13 weeks. The current sampled quarter is indicated on the right side of the page, with links to view other quarters’ reports. All visits are categorized into four frequency bins:
- Weekly: Plates that are detected at least weekly
- Twice a month: Plates that are detected at least every two weeks but less than weekly
- Monthly: Plates that are detected at least monthly but less than fortnightly
- Less frequent: Plates that are detected less frequently than once a month
For each frequency bin, data is compiled into several categories to explain patterns:
- Quarters: Number of plates with indicated frequency for the current sample quarter and the same quarter a year ago, with its percentage of all visits
- Lost to another category: The number of plates from a year ago to current that left this frequency bin to another
- Gained from another category: The number of plates from a year ago to current that entered this frequency bin from another
- Not returning: The number of plates present in this frequency bin a year ago but not currently
- New since: The number of plates currently present in this frequency bin but not a year ago
- Visits during: The total number of visits pertaining to the frequency bin
- Average dwell time change: The amount of change in average dwell time for this frequency bin from a year ago to present, in minutes. A positive number indicates increase in dwell time, a negative number a decrease.
The table view displays a 100% stacked graph of visit amounts attributable to each frequency bin, with separate graphs for the currently sampled quarter and the same quarter a year ago.
This graph can be exported to PDF and PNG image formats.

