Turnover
This report provides rich information on the patterns of bay turnover at the site, broken down into three tabs. When exported, all tabs are present in exported output.
See Definitions for more information.
Summary Tab
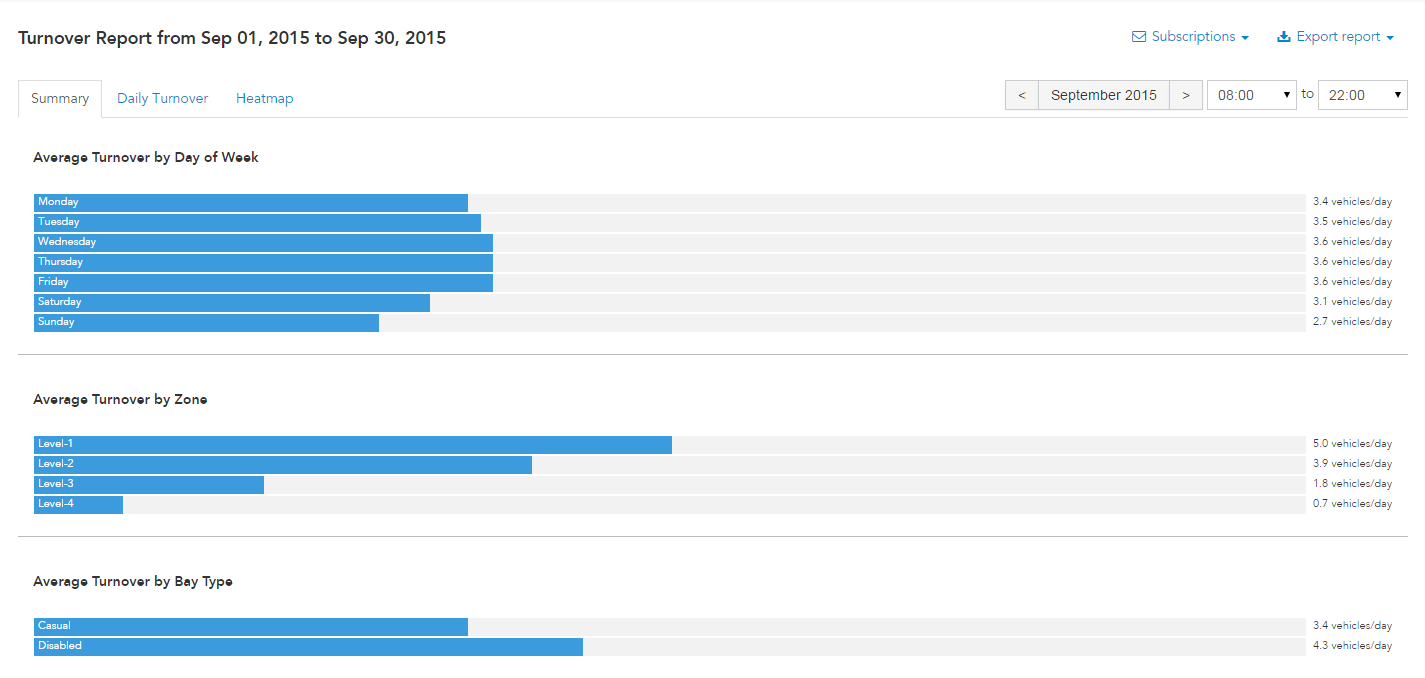
Bar graphs render turnover information three basic ways, within the set time and date range.
- The Average Turnover by Day of the Week: Site-wide average turnover broken down by day of the week
- Average Turnover by Zone: Average turnover broken down by zone
- Average Turnover by Bay Type: Average turnover broken down by bay
Daily Turnover Tab
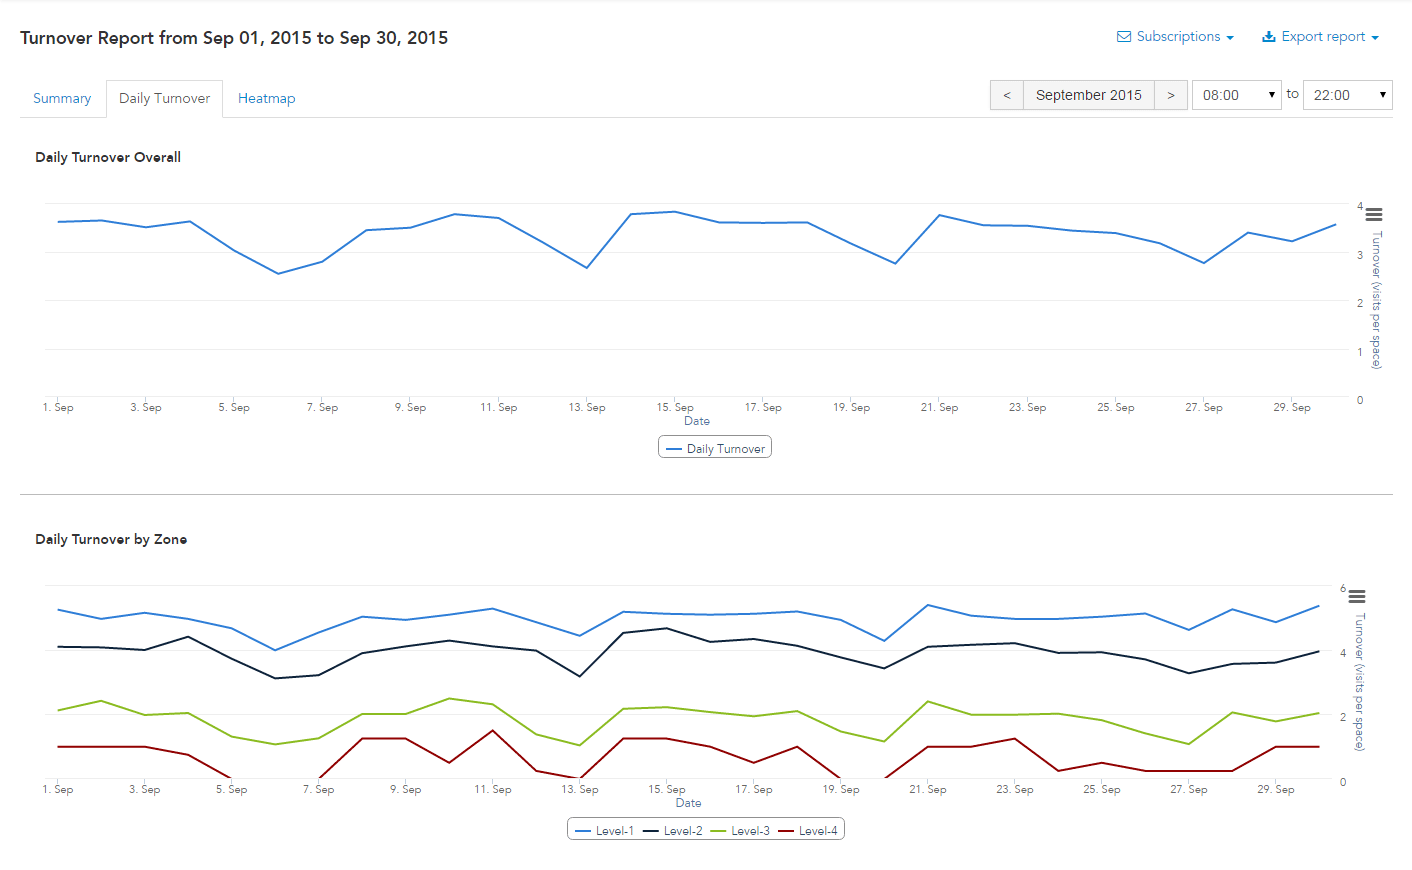
Line graphs display the pattern of turnover, averaged into 30-minute intervals for all days within the date range. Time range is ignored for this tab. Hovering the cursor over each graph line reveals the specifics of that data point. Individual graphs can be exported by clicking on the three-bar icon at top-right of the graph.
- Daily Turnover Overall: Average turnover day-by-day
- Daily Turnover by Zone: Turnover broken down by zone, day-by-day
- Daily Turnover by Bay Type: Turnover broken down by bay type, day-by-day
Heatmap Tab
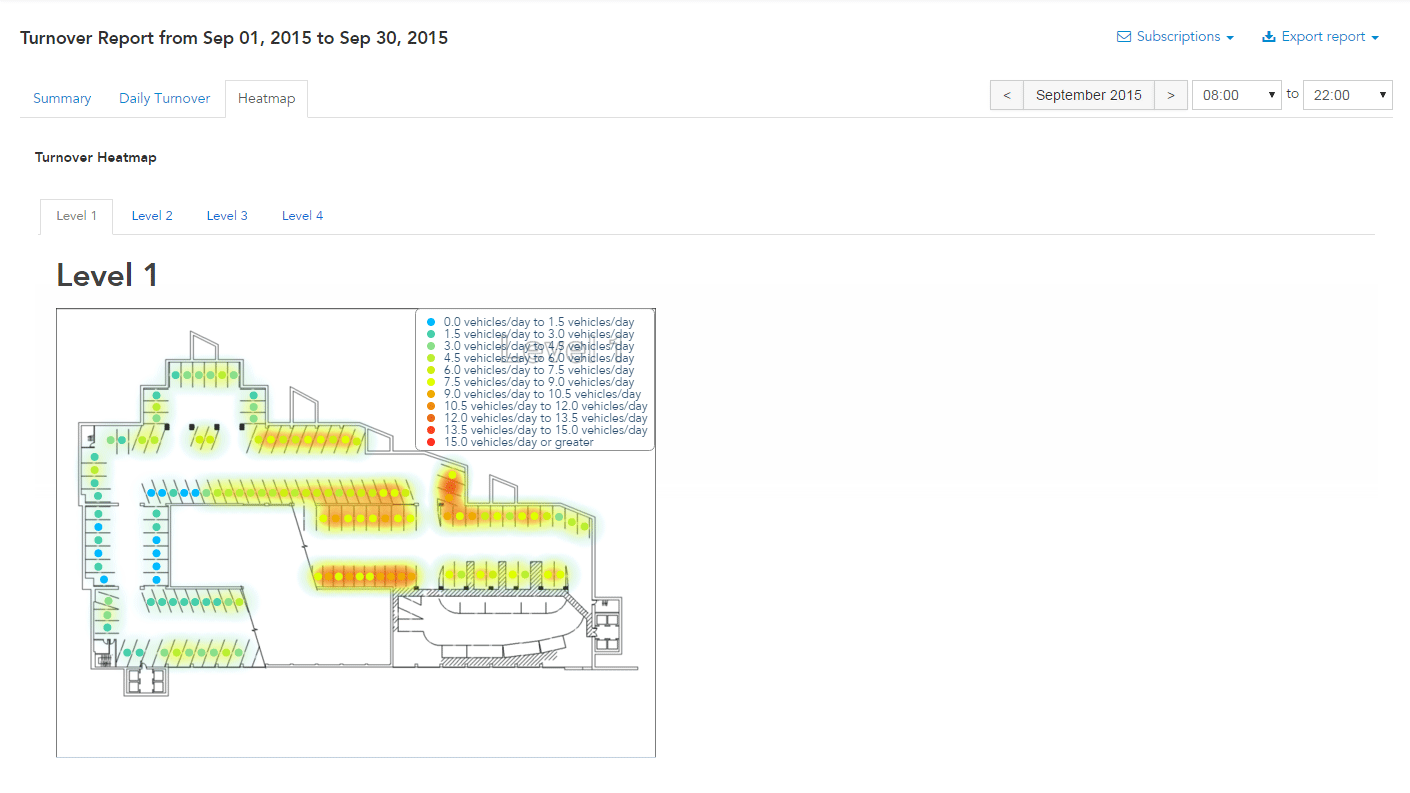
This tab provides a visual guide to average turnover by individual bays, within the set time and date range. “Warmer” color areas indicate higher turnover, with “cooler” areas showing lower turnover. Heatmaps are provided for each zone of the site. Hovering the cursor over a bay displays its unique bay ID.